Supplementary material:
Computer assisted detection of abnormal airway variation in CT scans related to paediatric tuberculosis
Benjamin Irving
Reference:
Irving, B.J., et al. Computer assisted detection of abnormal airway variation in CT scans related to paediatric tuberculosis. Med. Image Anal. (2014), dx.doi.org/10.1016/j.media.2014.05.007
1. Supplementary interactive figures:
Interactive figures that illustrate the method are provided below. A modern webgl compatible browser is required to view these figures.
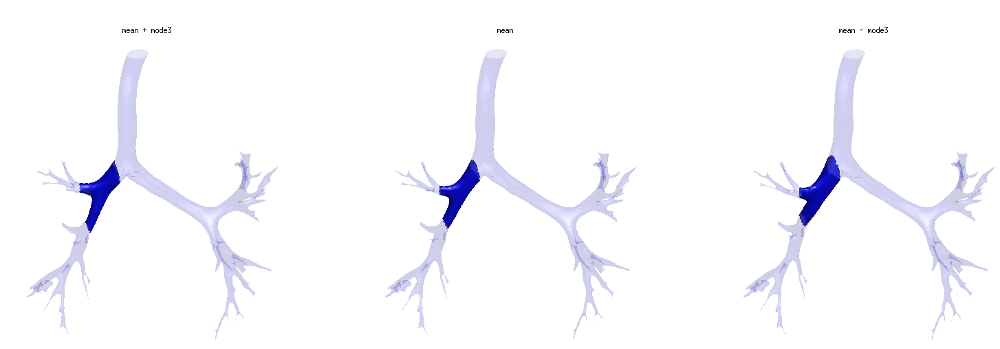
Figure 1: Variation along the first principal component of the RMB-RUL-BI region (as shown in Figure 14(1) in the journal article)
PCA mode 1
(+ λ → 0 → - λ)
Click and drag figure to rotate. Scroll to zoom.
Move the slider to show the variation along one statistical mode
Slider for each transform
Move each slider to the right to perform template warp
Click and drag figure to rotate. Scroll to zoom.
2. Airway model:
The airway shape models and matlab code to load and displays the modes of variation are downloadable below
Download model and example codeThe statistical shape models are stored in:
- trachea_ssm.mat - Trachea-LMB-RMB
- rmb_ssm.mat - RMB-RUL-BI
Using the model:
- Running demo1.m illustrates how the data can be loaded in matlab and visualised.
- For a selected mode of variation is produces three plots of the mean shape, and 3 standard deviations along the mode of variation.
- Figure 1 shows just the ROI and Figure 2 shows the ROI in terms of a representative airway
- The representative airway is just for illustrative purposes
- These figures can be rotated to view the 3D shape
3. Example output:
4. Release of Analysis Code
The authors intend to release parts of this analysis algorithm