Update
I’ve shut down the live tracker now but it was an interesting experiment. A screenshot of the app is shown below
Previous article
I’m a big fan of Python and the general improvements that have come with Python 3. While Python 3 growth has been slow it seems that with the introduction of Python 3.5, Python 3 is beginning to gain momentum due to the steady introduction of neat new features such as type hints and @ matrix multiplication.
There still seems to be a belief that Python 2 is better supported than Python 3. but Python 3 should actually by now be better supported based on a projection that more libraries will support Python 3 compared to Python 2 as of May 2016.
Given this I thought it would be useful to crunch on the proportion of Python 3 vs Python 2 package downloads again. A number of people have done this in the past but I thought that it would be neat to have some sort of live tracker to get a daily update on Python 3.
As stated before, there is a lag in these results because of the large quantity of legacy Python 2 software that is still being used on a day to day basis. So the picture of Python 3 based on what is currently being developed now is likely to be more positive than these numbers.
Nevertheless, I thought it would be interesting to create a live tracker that updates daily giving the proportion of Python 3 downloads of a number of key packages from PyPi. I wanted a data science focus so I made a fairly arbitrary choice of 6 packages that I used a lot: numpy, scipy, scikit-learn, scikit-image, pandas and theano.
Results
The results are based on the PyPi bigquery database which stores information on every download. This query extracted and collated any download of the above 6 packages using pip with either version 2 or 3 on a daily basis.
Results are based on data from this year – the data available – so the results will get more interesting as more data becomes available. This live graph updates daily.
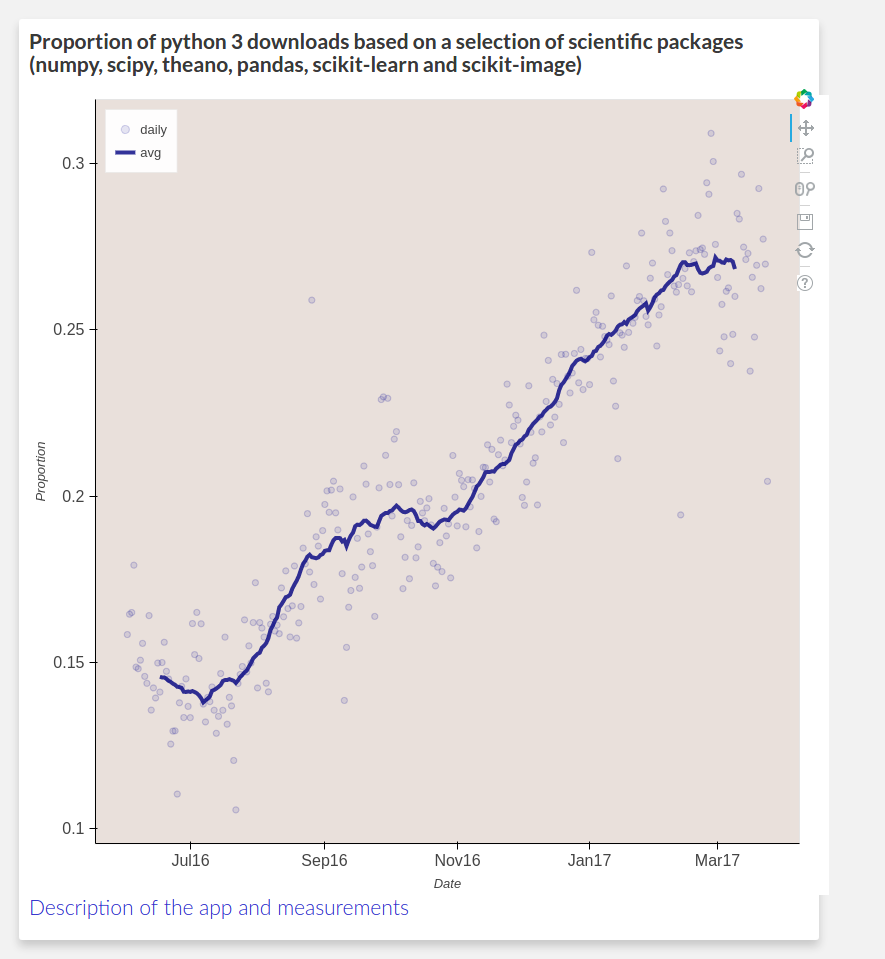
Based on these packages, while Python 3 only seems to make up 20% of the downloads, from June there seems to be a steady trend upwards. I expect that this will accelerate in the next year or two as projects begin to drop Python 2.
A large proportion of these downloads might be due to legacy software and the number of new projects being developed in Python 3 is probably much higher than this proportion. Nevertheless, this is probably a fairly good indicator of the state of general python use for scientific applications. Hopefully growing fast in future!
Disclaimer: To the best of my knowledge this is correct. But it was my first time using various tools such as BigQuery so I will need to triple check the queries.
App creation
A few details on the steps to create this live pytracker app:
- Python and SQL script to query the-psf:pypi daily download dataset and extract Python 3 and 2 download statistics for the 6 packages of interest
- Store daily results in a mySQL database and calculate daily package proportions into a new table
- Python FLASK app to query the mySQL table and serve a Bokeh plot of the current data. App sits on a small VPS Server.